Interacting with a Run Analysis
Colimit automatically generates useful Solutions and Analyses, but sometimes you need to interact to provide more context about what you know about the error or your codebase.
Standard Analysis Mode
When one of your GitHub Actions Workflow Jobs fails, by default Colimit processes it with the Standard Analysis Mode. This mode strikes the right balance for most errors, and takes up to 2.5 minutes to complete.
Clear Memory
If the default solution is not good enough, you can interact with the Debugging Notes by clicking the Add Context button. Once the modal opens, you'll be able to add any extra information that you know about the error or intracies about your codebase. For example, below a team discussion about the bug was copy and pasted as more context from a Slack conversation.
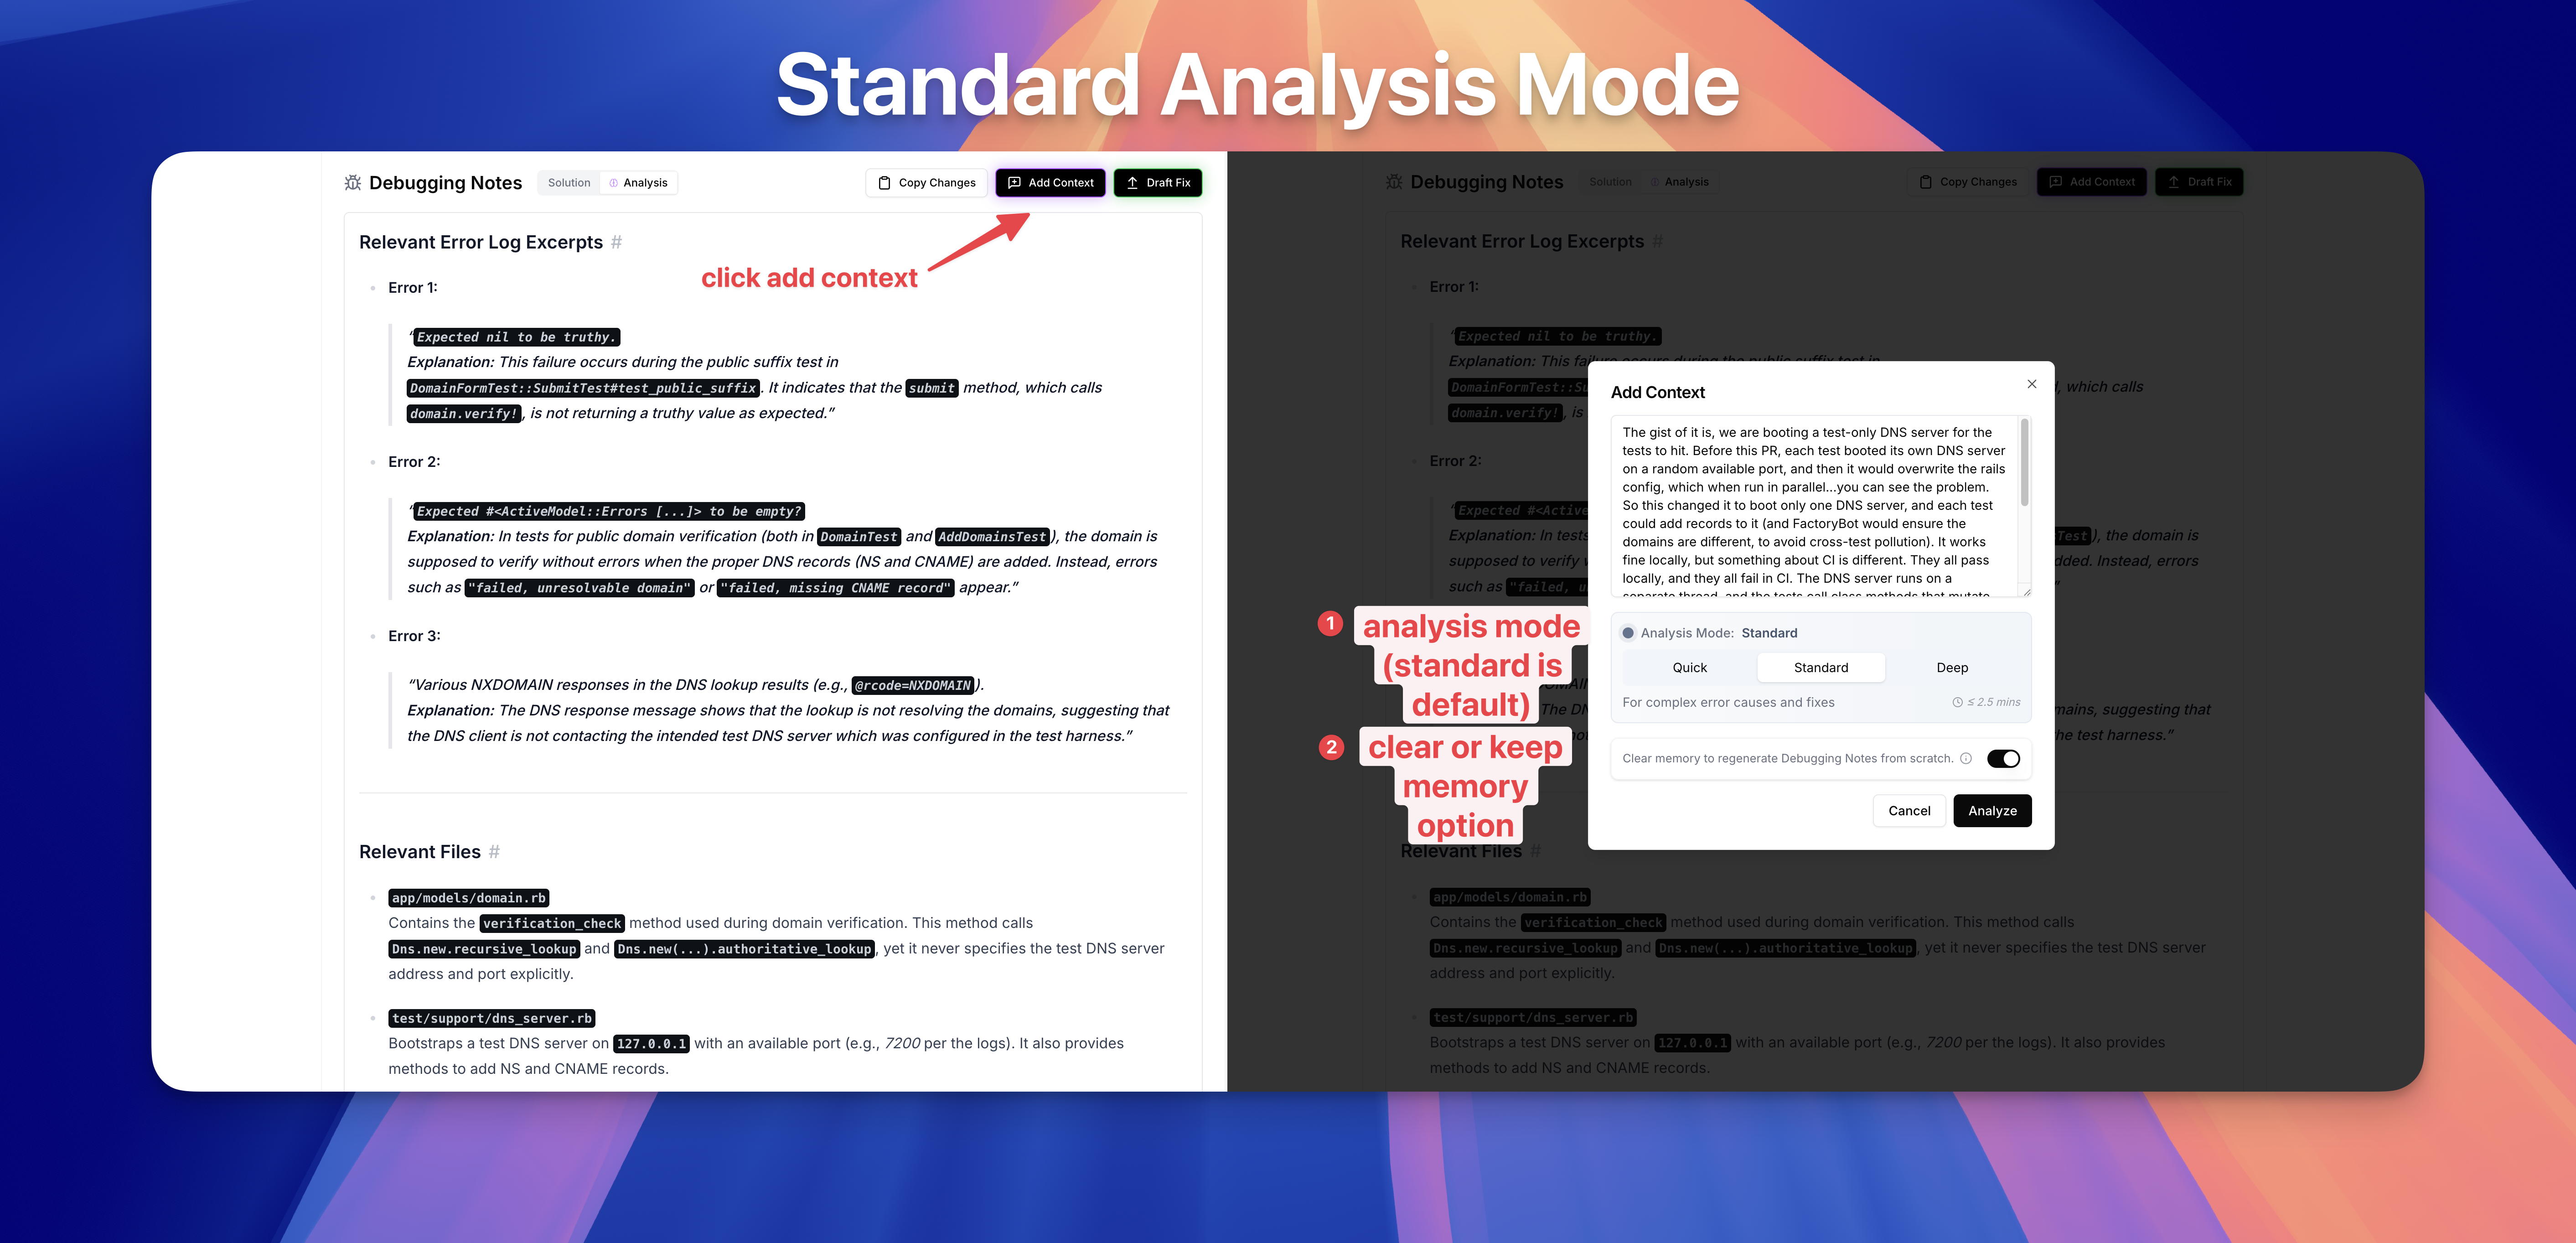
Above, we have additionally chosen the Clear Memory option by toggling it, which regenerates a new analysis and comes up with a new solution from scratch. This is useful if you want to completely "re-roll" a new analysis, for example when providing some additional team context and avoiding bias from the previous analysis.
Keep Memory
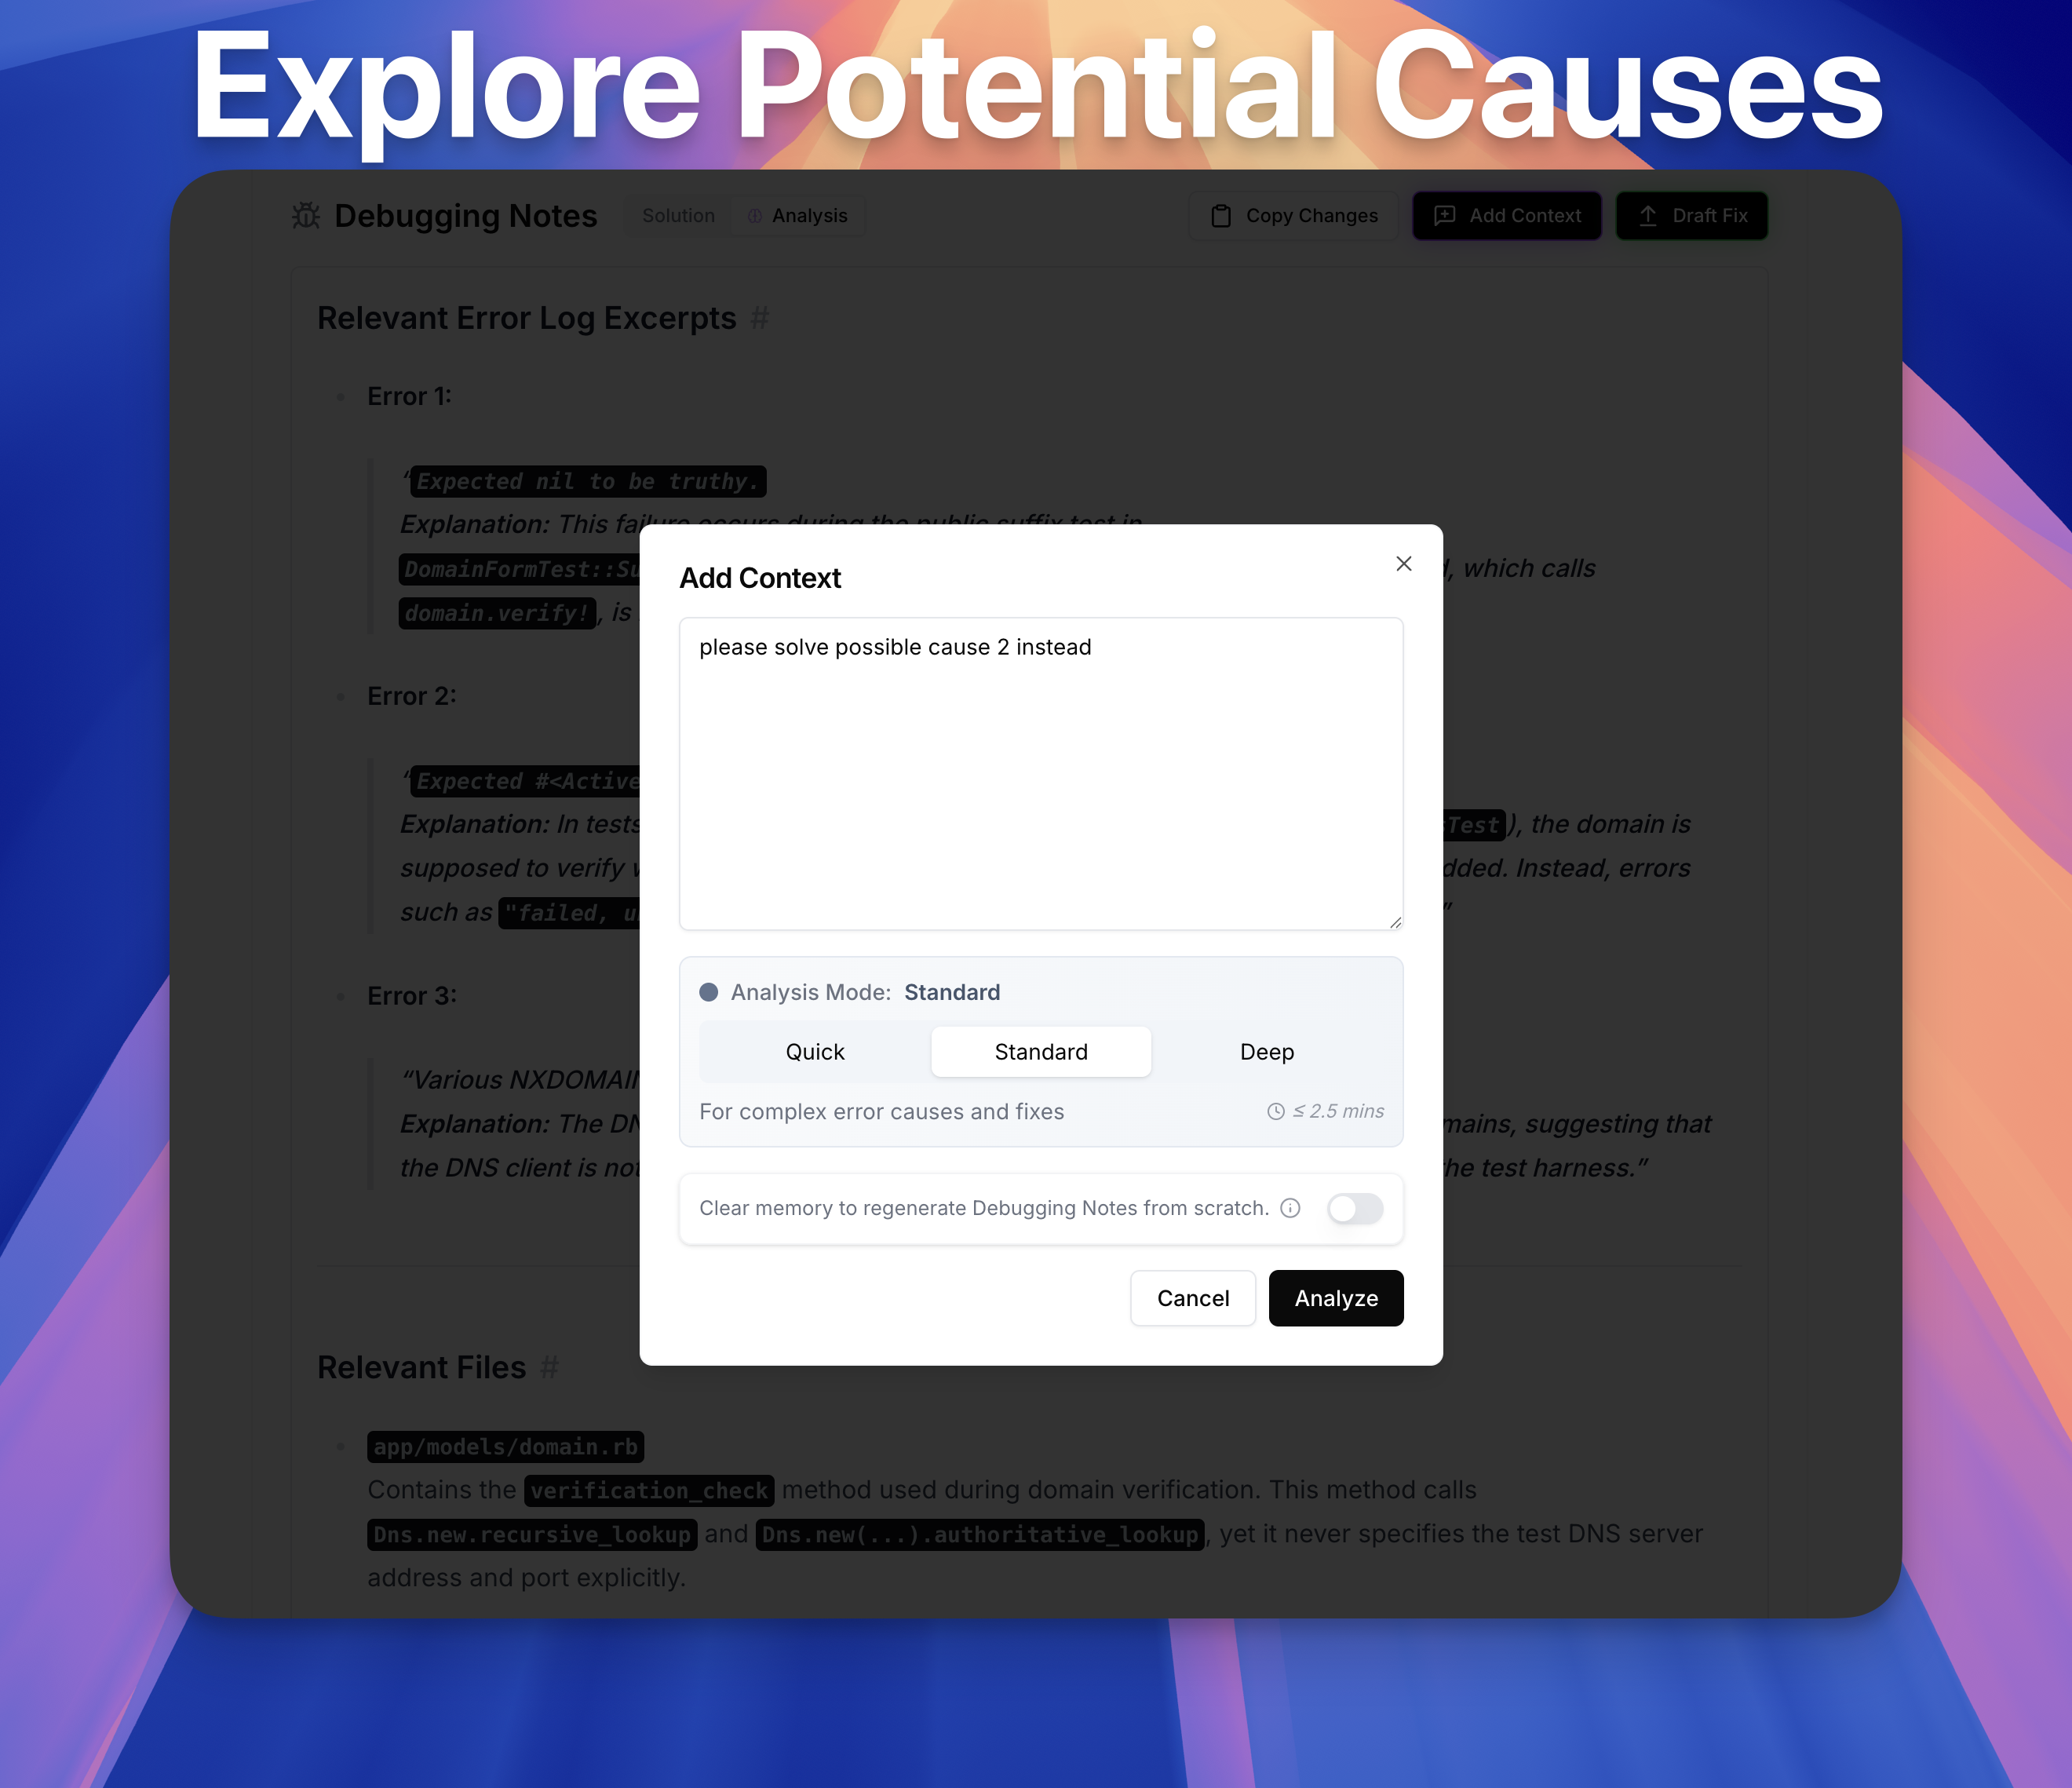
Alternatively, you can Keep Memory, which allows you to refer to the previous analysis and solution, but add any additional context that you think might help. When you keep memory (by untoggling the Clear Memory option), you can refer to things in the current analysis. For example, below we instruct Colimit to prefer to use Potential Cause 2 as its most likely solution.
Deep Analysis Mode
If you're working on a very complex bug, which would normally takes hours/days/weeks to fix, you can use the Deep Analysis Mode. This turns up all Colimit's internal parameters to their maximum settings (for example, the number of hypotheses to consider, the number of critique iterations, the codebase search depth, etc.), and it uses the most powerful LLM models available for various internal subtasks.
This takes up to 5 minutes to complete, but can yield important insights that would otherwise be missed in the Analysis tab.
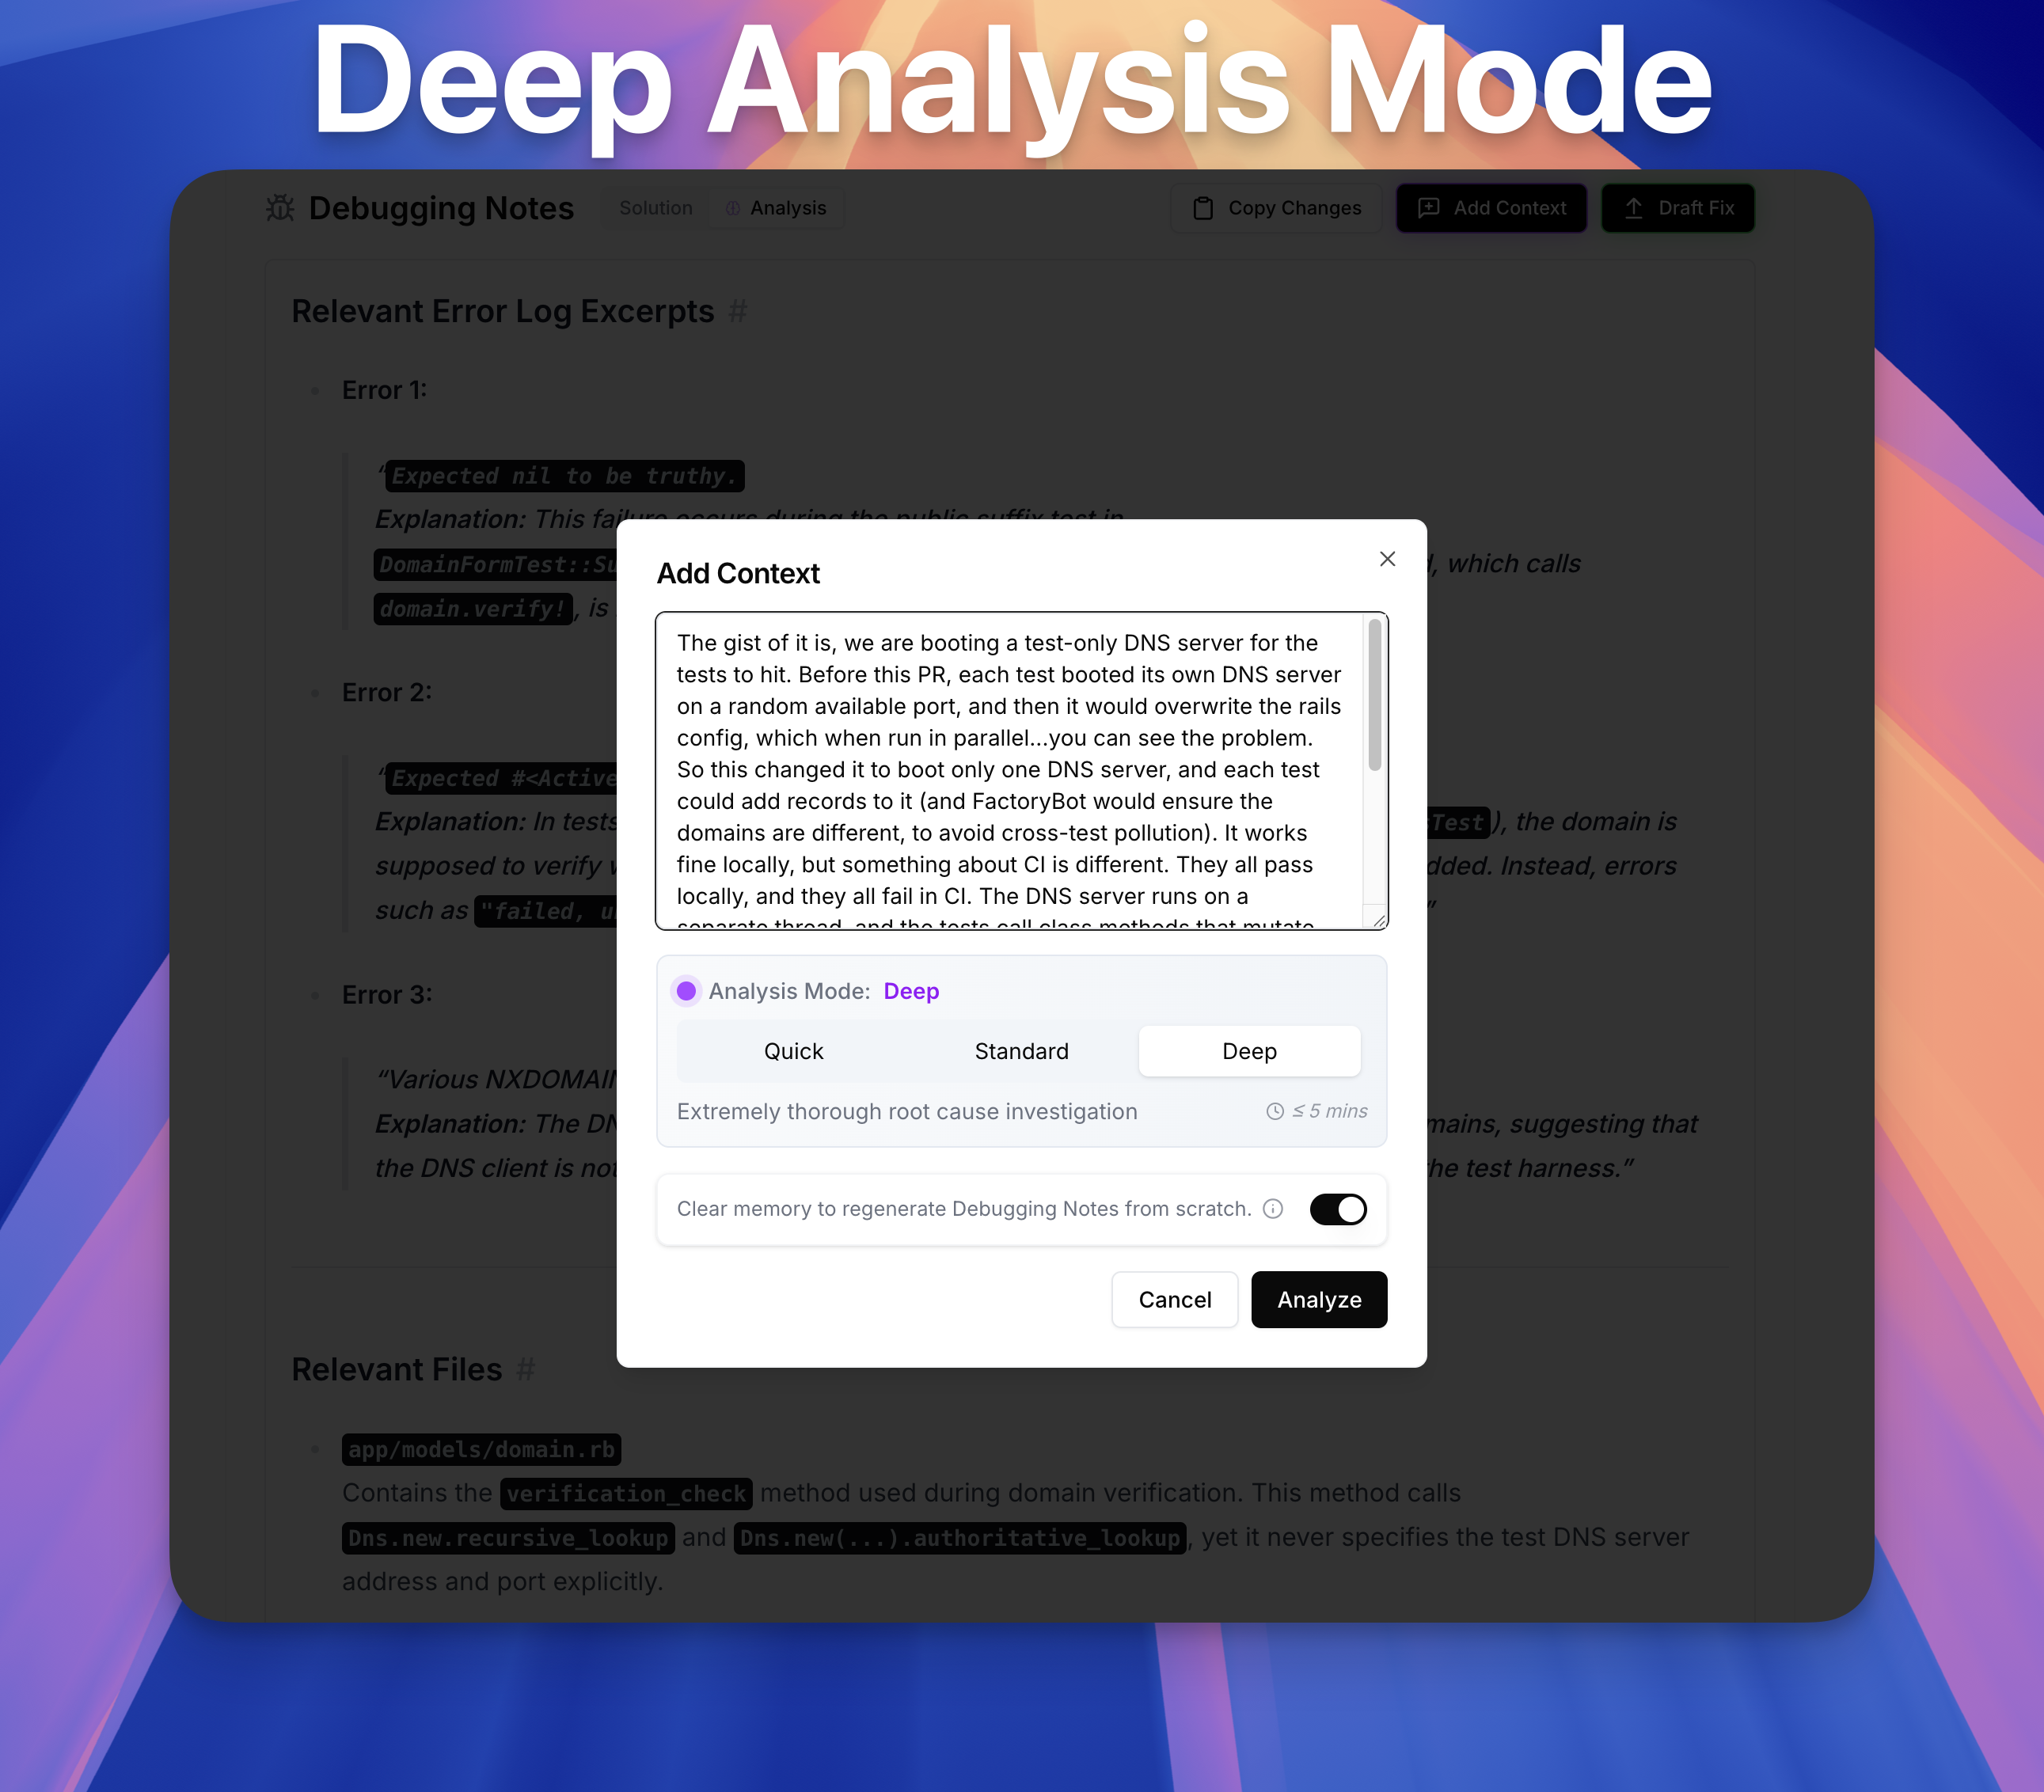
Note that when moving from the Standard to the Deep Analysis Mode, the Clear Memory option is encouraged. This is because LLM models tend to suffer from bias from previous answers, even if the previous answer is coming from a less exhaustive analysis or dumber model.
Quick Analysis Mode
Finally, Quick Analysis Mode is the fastest mode, and takes up to 1 minute to complete. It's a good option when you have a really basic error, like a linting error or a typechecking error.
It's also a good option if you like the solution Colimit picked, but you want to customize it in some way. For example, below we ask Colimit to add a comment about the code in the solution it came up with.
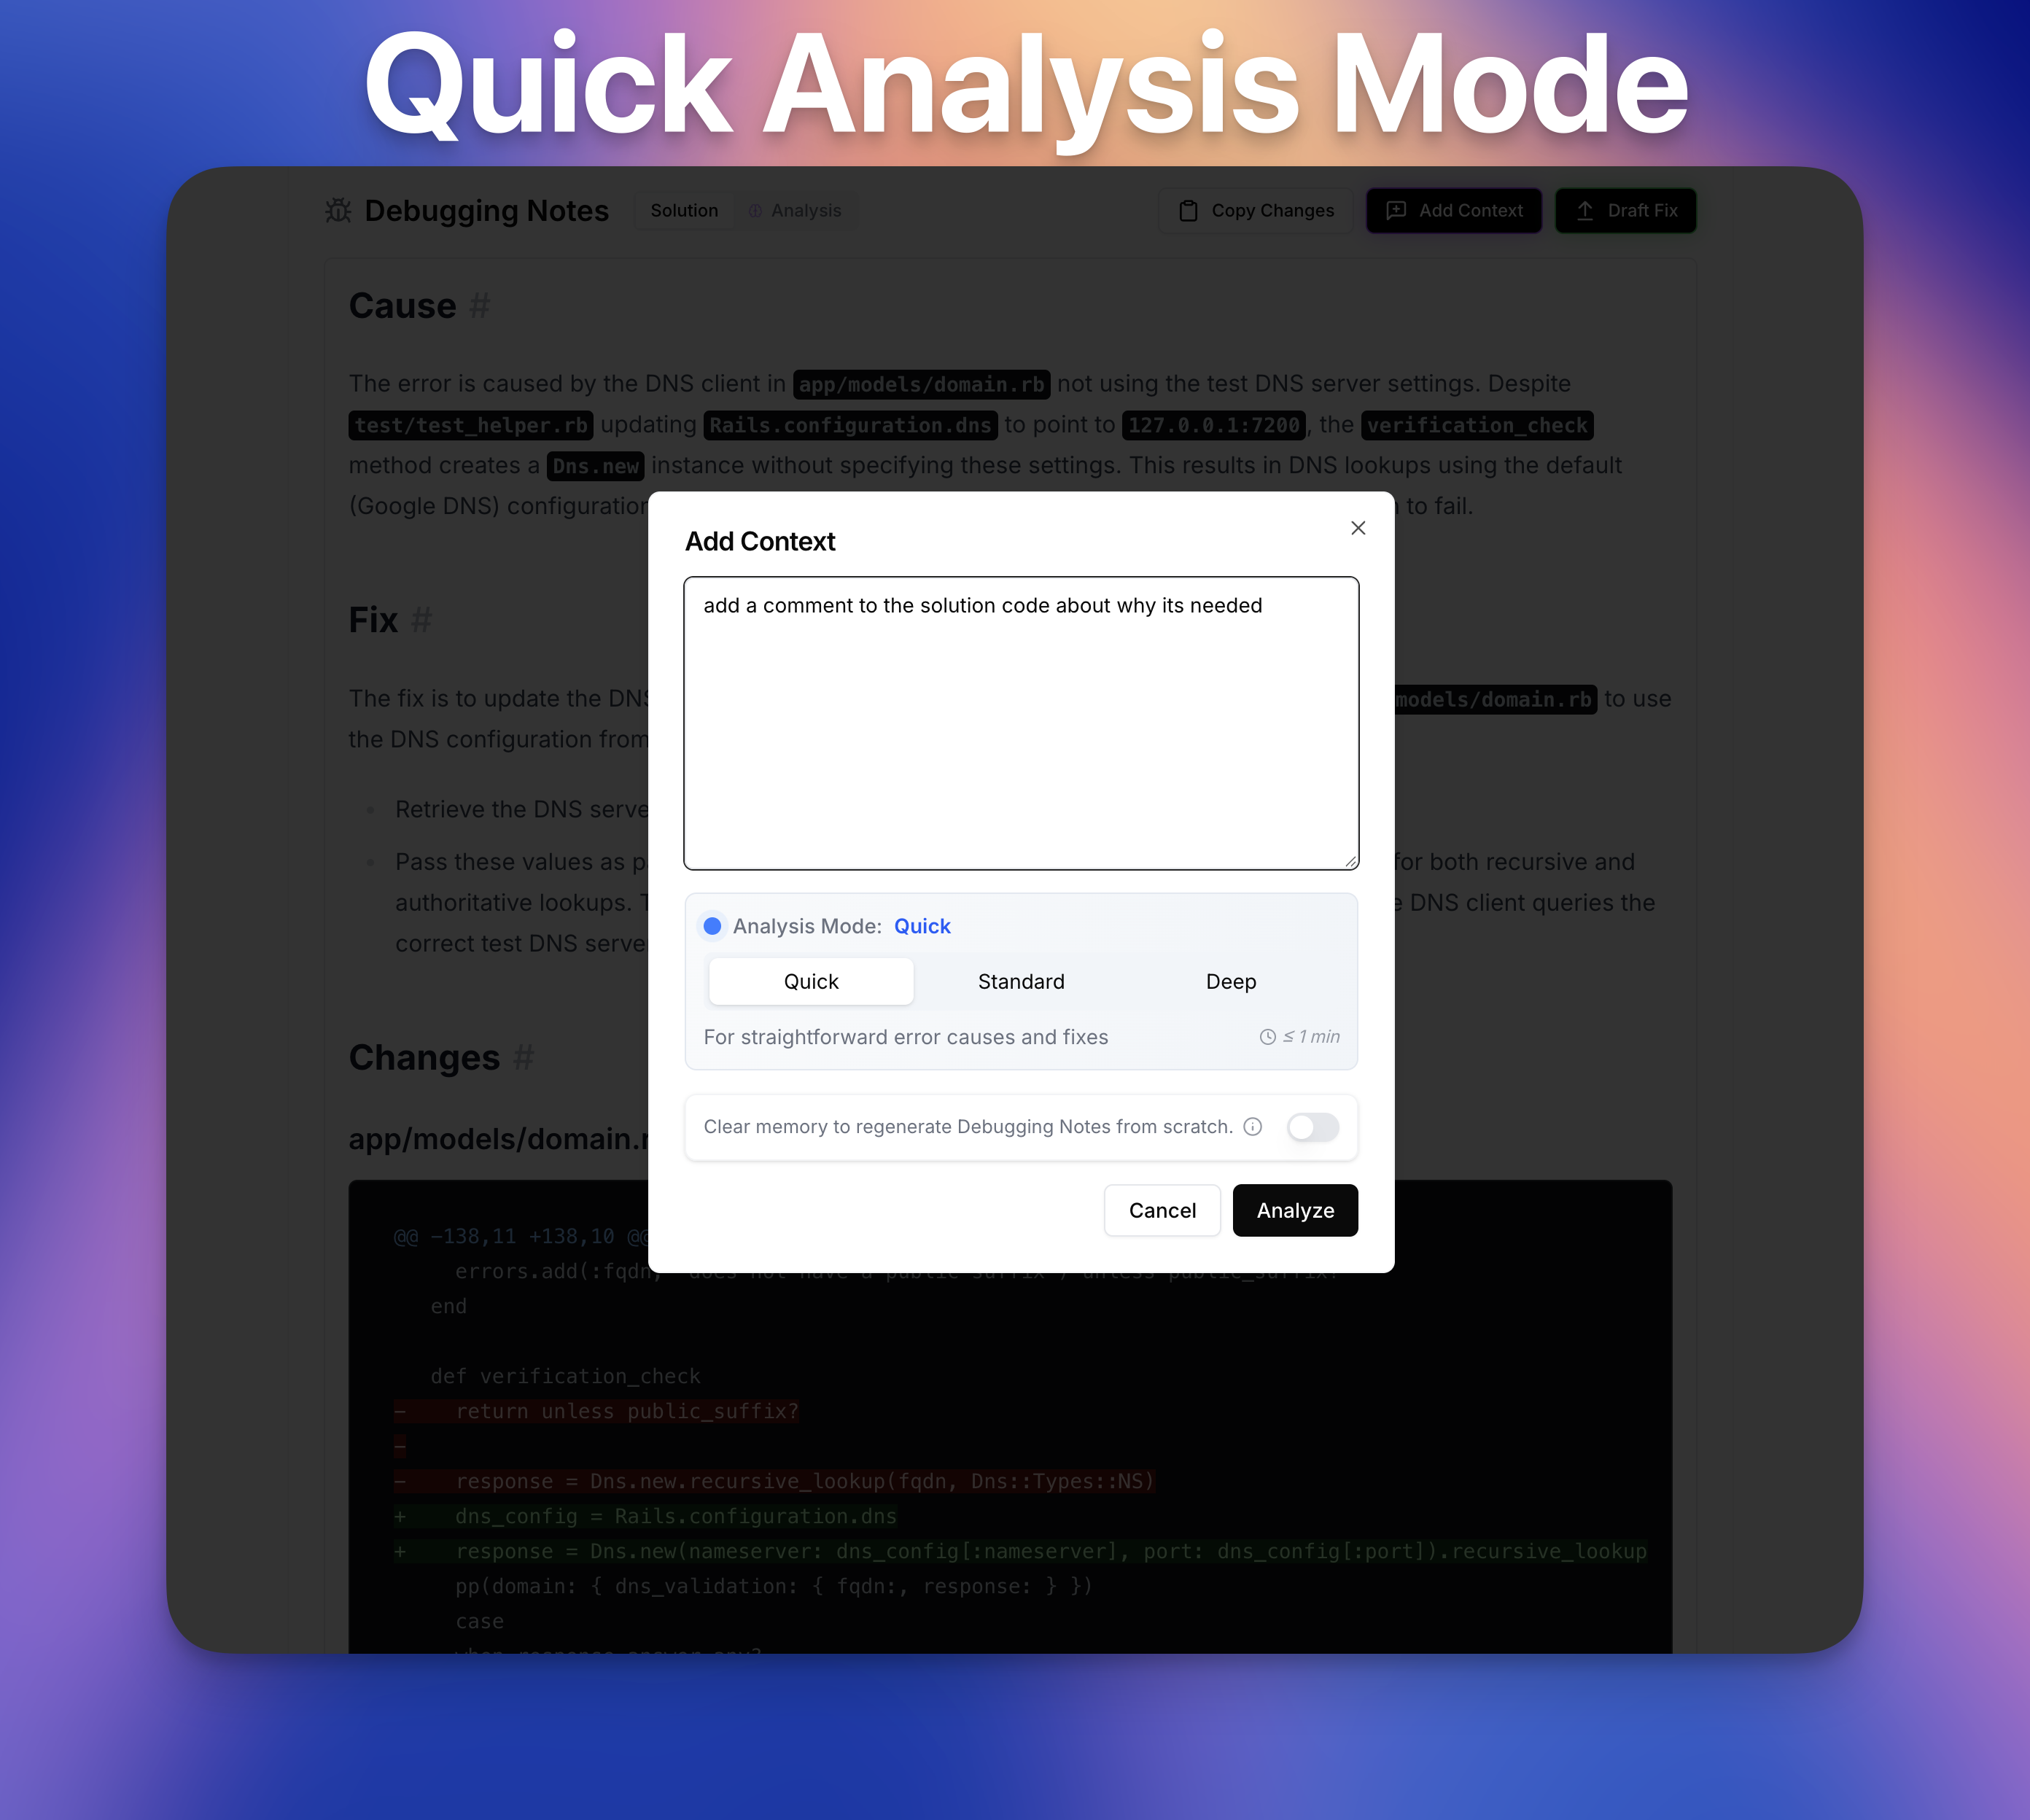
Most of the time you want to avoid toggling Clear Memory when using a Quick analysis, because the model will only solve basic errors from scratch.